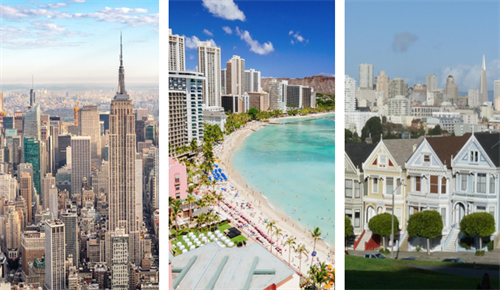
This week, the first quarter 2019 Cost of Living Index was released, and it measures what cities will give you the most “bang for your buck,” and those that’ll “break the bank.”
The study analyzed data from 257 urban areas by looking at the after-tax cost for a professional/managerial standard-of-living for the cost of housing, transportation, health care, groceries, and consumer goods, such as electronics, furniture, and cars.
While this may not be surprising to many, the cost of living in Manhattan, and in neighboring Brooklyn, were among the priciest places - - along with San Francisco, Honolulu, and Seattle.
Housing was the biggest expense for those living in the top 5 cities, comprising 29.34% of the overall cost-of- living composite index.
For example, the cost of living in Manhattan is twice the national average with median home prices coming in at approximately $1.2 million, while the median home price across the U.S., came in at around $234,400.
Day-to-day living is also much more expensive in the “Big Apple.” According to Numbeo, a meal at McDonald’s will cost $9, while a cappuccino, $4.54. Across the pond, in New Jersey, that same espresso, topped with frothed milk, will run you about $4.15, and the junk food about $7.95.
It’s also not coincidental, that the majority of the top ten most expensive cities, are also leading hubs for technology, where a host of successful companies like Google and Amazon have set up camp. Some data suggests that the influx of tech workers are driving up the cost of rent and pushing middle to low-income residents out of city-centers.
The lower cost urban areas included Arlington, Boston, and Orange County.