A Year After Election, Fewer Satisfied With State of U.S.
Story Highlights
- 21% satisfied with direction of the U.S., down from 28% a year ago
- Americans are more confident in the economy
- Trump image better than before election, but still negative
Since Donald Trump upset Hillary Clinton in the 2016 presidential election
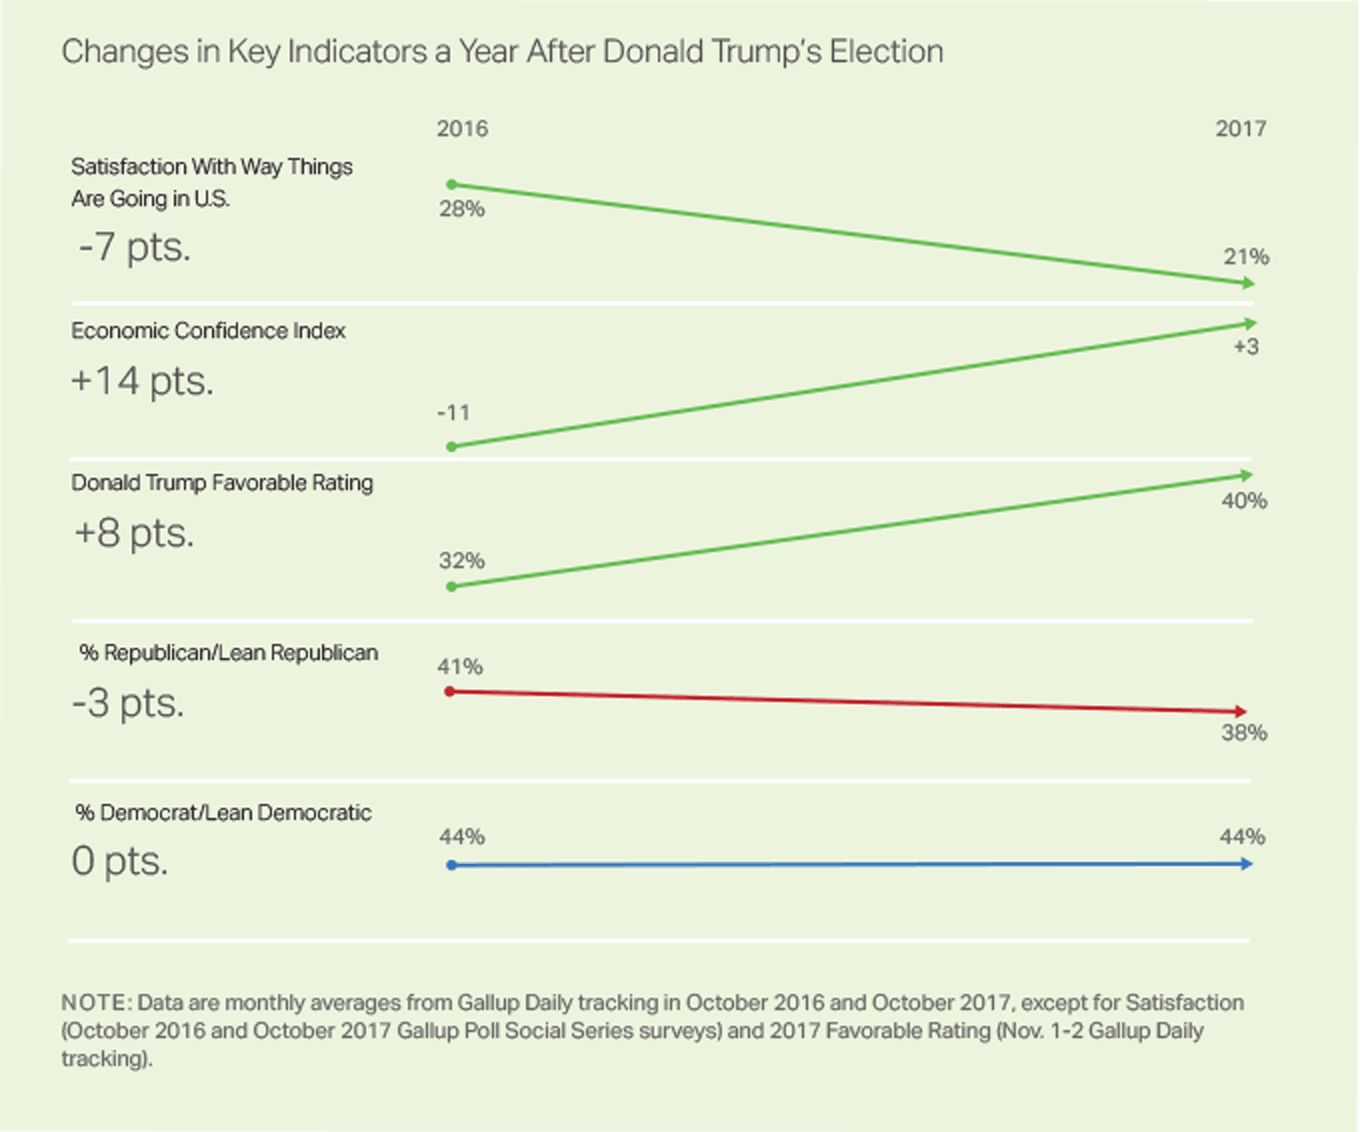
a year ago, some key indicators are better while others are worse. Americans'
confidence in the economy has improved, as has Trump's favorable rating.
At the same time, Americans' satisfaction with the direction of the
country has worsened -- and, with Trump still viewed more negatively than
positively, the percentage of U.S. adults identifying as Republican or
"leaning" Republican has declined slightly. There has been no
change in Democratic Party identification or leaning.
These results are based on a comparison of recent Gallup data on key indicators
with the same indicators in October 2016.
National Satisfaction
In October 2016, about a month before Trump won the election, 28% of Americans
were satisfied with the way things were going in the U.S. In the most
recent update, conducted in October 2017, 21% said they are satisfied.
There have been some short-lived increases in satisfaction in the past
year, with a few readings above 30%. These include a
Democratic-led surge in satisfaction in an early November 2016 poll, perhaps on the expectation Clinton would
win, and a
Republican-led increase earlier this year after Trump's inauguration.
The
most recent satisfaction rating is from a survey taken in the days after the Las Vegas mass shooting,
which might have depressed satisfaction levels. However, satisfaction
was at 25% in Gallup's September update, also lower than a year ago.
Economic Confidence
Apart from a
brief period in late 2014 and early 2015, Americans' evaluations of the U.S. economy (both present and future)
had been more negative than positive since the 2007-2009 recession. But
Gallup's Economic Confidence Index
shifted from a negative to a positive score as soon as Trump was elected, mostly because Republicans' economic
outlook improved.
The index --
which averaged -11 in October 2016, the last full month before Trump won --
peaked in January at +11. Confidence has eased slightly in the ensuing months, but the index has
remained positive each month, including a score of +3 in the October monthly reading.
Trump's Image
Americans' basic opinions of Trump remain more negative than positive,
with 40% having a favorable opinion of the president and 53% an unfavorable
one, according to a Nov. 1-2 Gallup poll. Trump's favorable rating
is slightly better than his
job approval rating, which has mainly been in the
mid-30% range since July.
However, Trump's favorable rating is better than it was during the
presidential campaign. In October 2016, his favorable rating averaged
32% and his unfavorable rating averaged 65%.
Trump's favorable rating never climbed out of the 30% range among U.S.
adults during the 17 months that Gallup tracked it from July 2015 to November
2016. Over the final eight days before the election, Oct. 31 through Nov.
7, Trump's image improved slightly from his October average, to 35%
favorable.
After he won the election in November,
Trump's favorability increased to 42% and improved further to 46% in February. By June, however, the percentage
of Americans with positive views of Trump was down to 40%, where it stands today.
Party Affiliation
Trump's unpopularity may be affecting the standing of his party with
the public. Currently, 38% of U.S. adults identify as Republicans or as
Republican-leaning independents. A year ago, 41% did. The percentage of
Democratic identifiers and leaners has not changed, at 44%. But the modest
Republican decline leaves Democrats in a slightly more advantageous position
than they were in just before the 2016 election.
Implications
Trump's presidency to date has been unlike any other, marked by his
flouting of political decorum and his
historically low first-year job approval ratings. Americans' more optimistic views of the economy have done little
to win Trump favor with the public, and to convince them things are going
well in the country. One reason that satisfaction may be lower is that
Americans regard the government as the most important problem facing the
country -- and
displeasure with Trump is one of the major reasons why.
With the 2018 midterm elections just a year away, Trump's Republican
Party stands in a weaker position relative to the Democratic Party than
it did when Trump won the 2016 election. Historically, unpopular presidents'
parties have tended to lose large numbers of congressional seats in midterm
elections. Unless things improve, Trump may join Bill Clinton and Barack
Obama in presiding over a divided government during his second two years
as president, after enjoying a one-party government his first two years
in office.
Survey Methods
These results are based on monthly averages from Gallup Daily tracking
conducted in October 2016 and October 2017, except for satisfaction (October
2016 and October 2017 Gallup Poll Social Series surveys) and 2017 favorable
rating (Nov. 1-2 Gallup Daily tracking). Gallup conducted telephone interviews
with a random sample of approximately 15,000 adults, aged 18 and older,
living in all 50 U.S. states and the District of Columbia. For results
based on the total sample of national adults, the margin of sampling error
is ±1 percentage point at the 95% confidence level.
Each sample of national adults includes a minimum quota of 70% cellphone
respondents and 30% landline respondents, with additional minimum quotas
by time zone within region. Landline and cellular telephone numbers are
selected using random-digit-dial methods.
Learn more about how the
Gallup U.S. Daily works.


